Our Environment

Energy Management
(GRI 3-3, GRI 302-1, GRI 302-3, GRI 302-4)
(SASB FB-MP-110a.2, FB-MP-130a.1)
Energy is a critical input across our value chain, from upstream commodity production to processing and distribution. Effective energy management is not only essential for optimizing resource use and reducing operational costs, but also for mitigating our climate impact and strengthening long-term business resilience in a rapidly evolving global landscape. We aspire to drive continuous improvement in energy efficiency and transition to cleaner energy sources to contribute to a more sustainable food system.
Managing Energy Consumption Across Our Operations
JBS’s energy management strategy is guided by our global sustainability aspirations, internal policies, and adherence to applicable regulations. Through a systematic approach, we aim to optimize energy consumption, minimize GHG emissions, and expand the use of renewable energy sources across our global footprint. Our advanced monitoring systems, facility-specific initiatives, and collaborative platforms work to foster innovation and knowledge sharing around energy management. As a material topic, we address energy management through a comprehensive, four-pronged strategy:
This strategy is applied across all sources of energy consumption and is supported by our environmental data management systems at both the business unit and facility levels. We closely monitor key metrics, including total energy use, total renewable energy use, and energy intensity (total energy use per unit of production), to track our progress and identify areas for further improvement.
Since 2020, we have invested more than US$188 million across hundreds of projects inside our own facilities to reduce Scope 1 and 2 emissions, primarily tied to energy use and methane destruction. Collectively, these initiatives will represent an annual reduction of over 550,000 metric tons of CO2e.
Energy Consumption
(GRI 302-1; 302-3; 302-4, SASB FB-MP-130a.1)
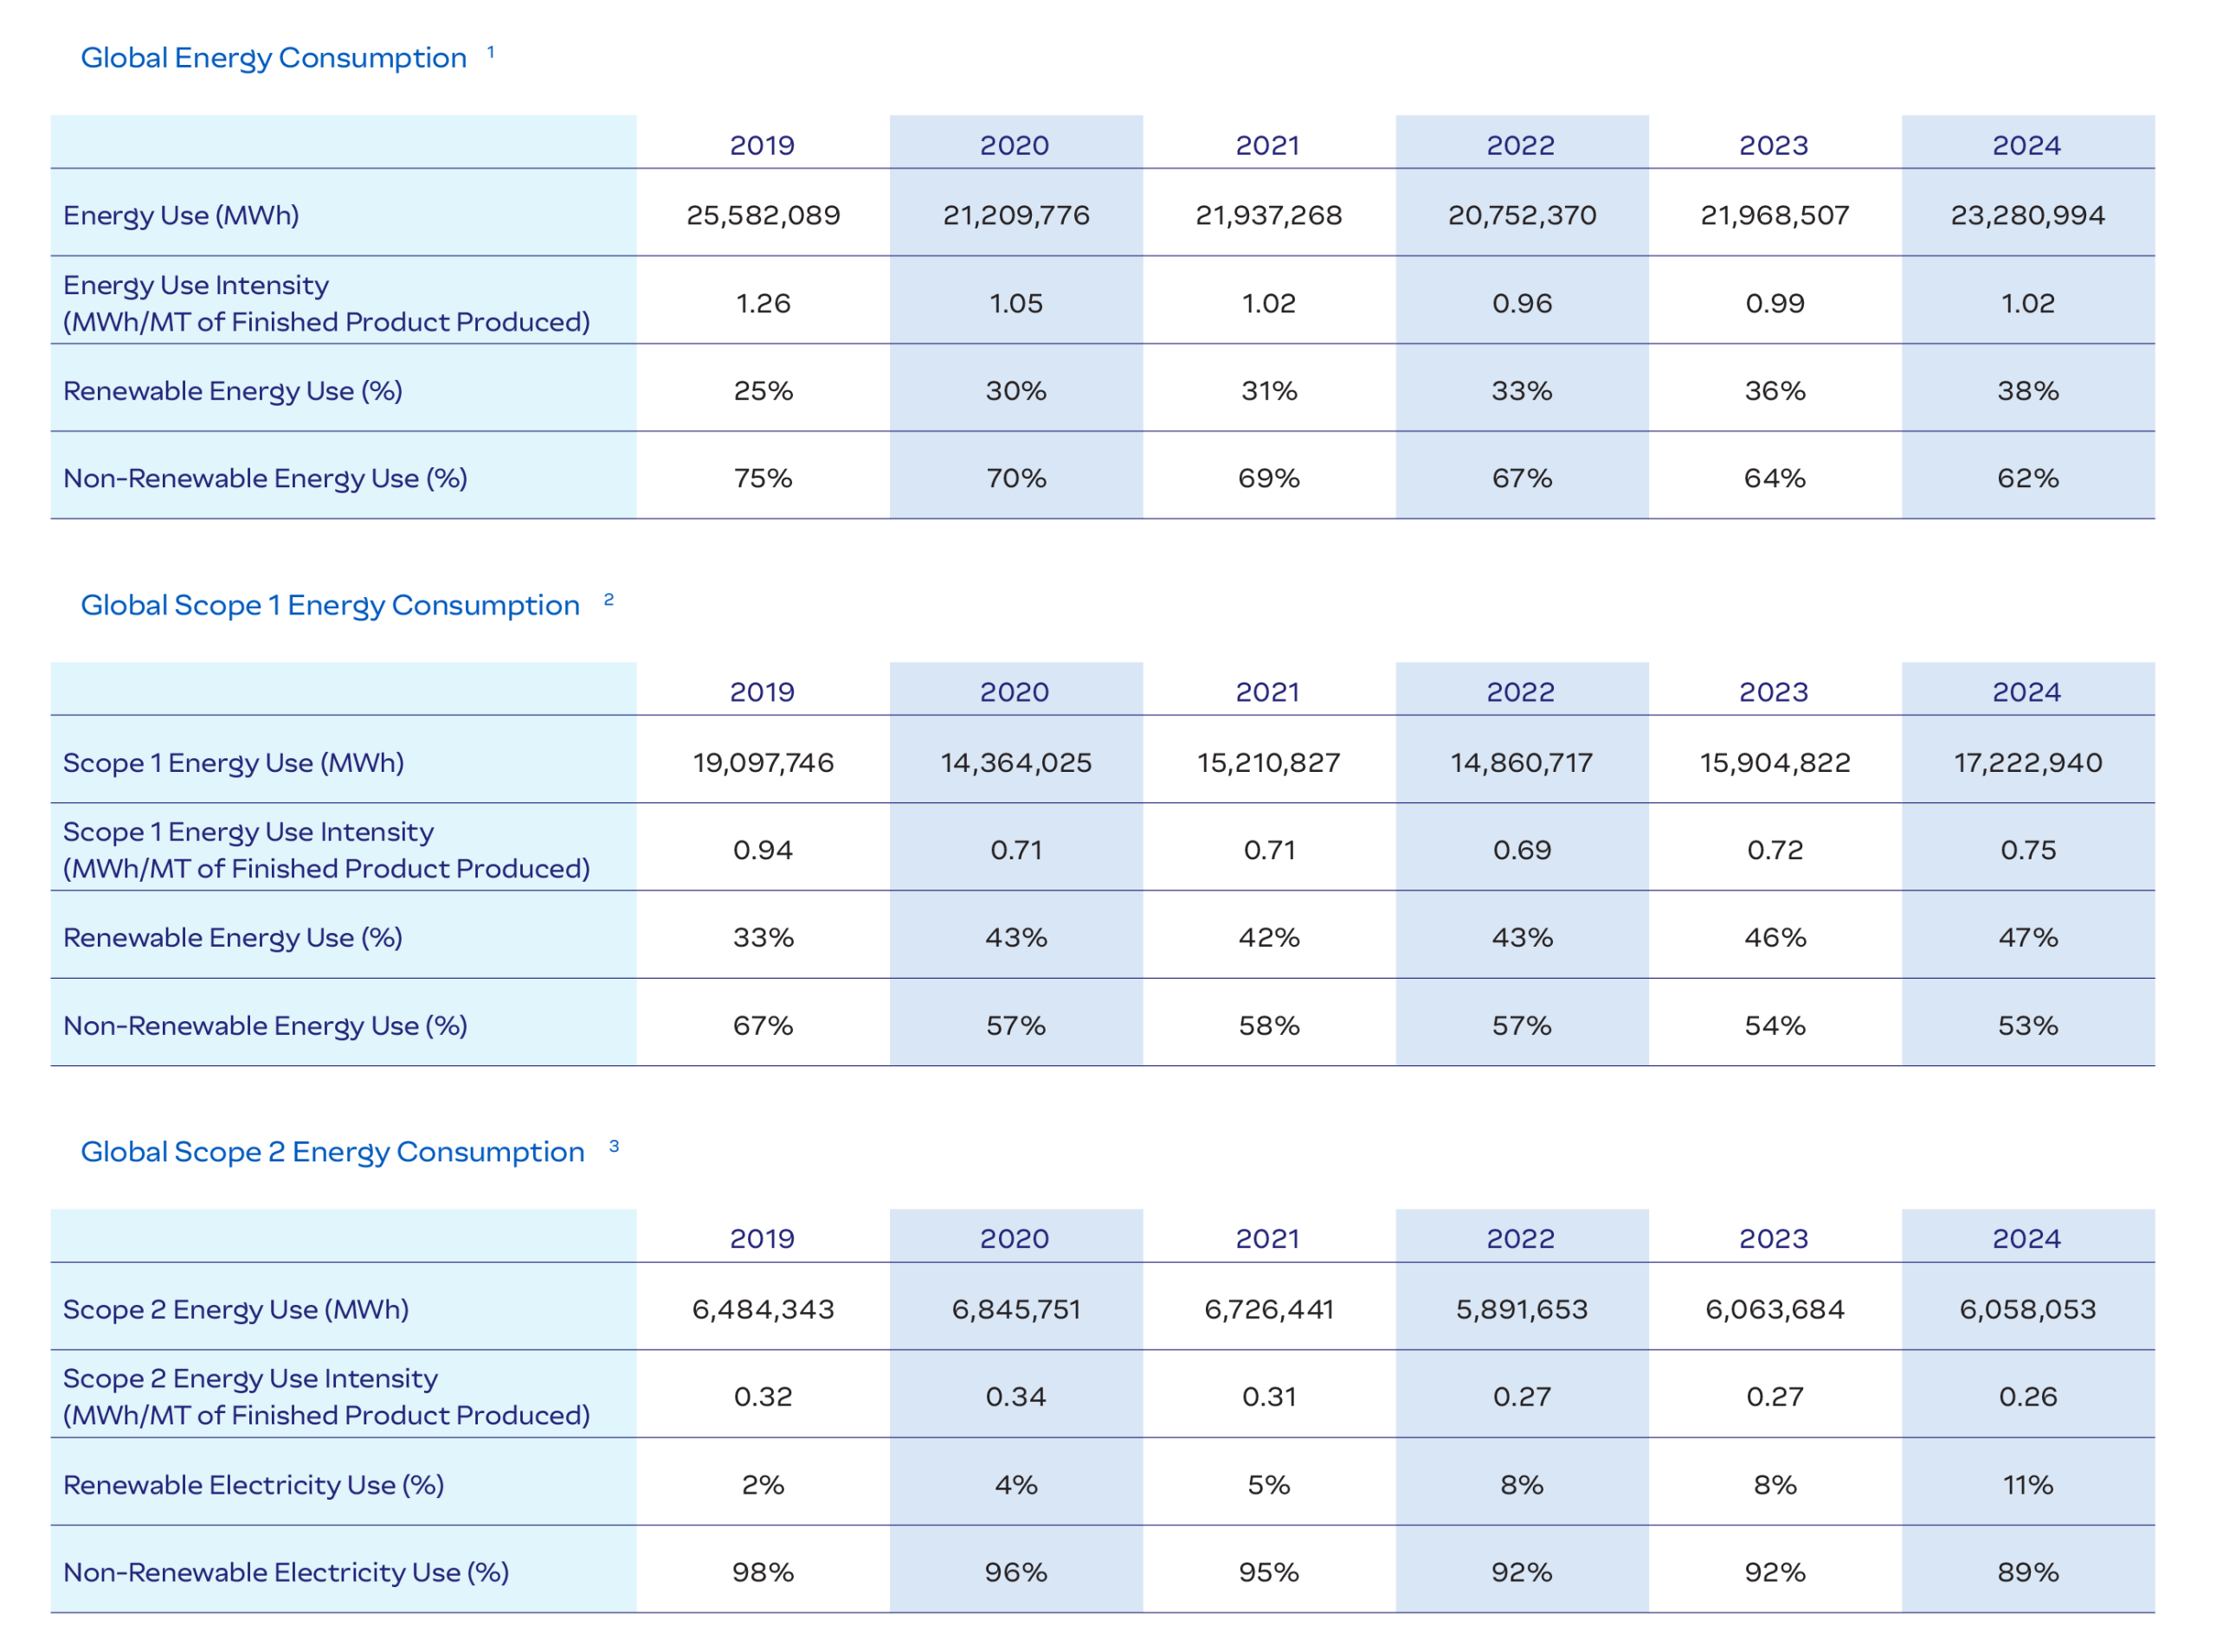
Energy consumption is monitored across JBS’s operations as part of our efforts to improve efficiency, reduce energy intensity, and support the transition to lower-emission energy sources. Our facilities rely on different energy inputs depending on operational needs and regional availability. We report total energy consumption, intensity ratios, and the share of energy from renewable sources, based on globally recognized reporting protocols and internal data systems.
Energy Efficiency
To reduce energy use in our facilities, our environmental and engineering teams are dedicated to identifying operational efficiencies, replacing equipment, and leading behavioral improvements by example. Alignment to internal processes allows us to recognize and prioritize impactful projects that range across a variety of areas and topics, such as optimization of refrigeration and steam operations, conversion to LED lighting, improvement of fleet fuel efficiency in our transportation units, covering of anaerobic wastewater lagoons for biogas collection, and more.
Across our operations, thousands of projects are implemented annually to improve production, food safety, mechanics, and more. In each of those projects our teams seek to incorporate changes to improve energy efficiency. This approach makes it more effective to incorporate energy efficiency projects and only amounts to incremental increases in capital spend.
Key Energy Efficiency Initiatives Include
Realizing Energy Savings Through Assessments
Across multiple JBS USA and Pilgrim’s U.S. facilities, we partnered with local utility providers and third-party energy consultants to identify energy savings opportunities, audit routine operations, and implement best practices. The facilities received on-site assistance, resulting in reductions from daily low-cost behaviors to capital-funded heat recovery projects. For example, our Arcadia, Wisconsin, chicken production facility has steadily reduced its electricity consumption by more than 15.5% since 2018, demonstrating the cumulative impact of smaller-scale, ongoing initiatives.
Renewable Energy
In tandem with improving energy efficiency, we are investing globally to increase our proportion of total energy consumption from clean sources. Globally, 38.1% of our energy use and 11.5% of our electricity use were derived from renewable sources in 2024.
Expanding renewable energy use is central to achieving our sustainability goals, including our goal of 60% renewable electricity by 2030 and aspiration of 100% renewable electricity by 2040. We actively seek opportunities to source electricity from solar, wind, and small hydroelectric plants through mechanisms such as Brazil’s Free Contracting Environment. In alignment with national policies, such as Law No. 10.295/2001 and ANEEL’s Energy Efficiency Program (PEE/ANEEL), we promote compliance while advancing renewable energy adoption.
Self-Generation Projects
Case Studies:
Friboi plants in Barra do Garças (MT) and Mozarlândia (GO) will soon be powered similarly, adding up to 1.1 million kWh to production—enough to power 6,000 homes monthly. By mid-2025, 18 generators will be operational.
- Total project investment: R$ 78.7M (R$ 55M JBS, R$ 5.3M Âmbar Energia, R$ 18.4M others).
- Biogas produced: ~50 million m³
- Emissions avoided: 263,700 MTCO₂e
- Energy generated: Ituiutaba – 1,179,017 kWh, Andradina – 874,000 kWh
- Forecast for two new units: ~1.1 million kWh