Our Environment

Water Stewardship
(GRI 2-23, 3-3, 303-1, 303-2, 303-3, 303-4, 303-5)
(SASB FB-MP-140a.1, FB-MP-140a.2)
Effective water stewardship is critical to the resilience of global communities, ecosystems, and JBS’s operations. As a vital resource, water plays an essential role in producing safe, high-quality food. However, increasing water scarcity and climate-related challenges threaten food security worldwide. At JBS, we recognize our responsibility as one of the largest global food companies to promote responsible water use.
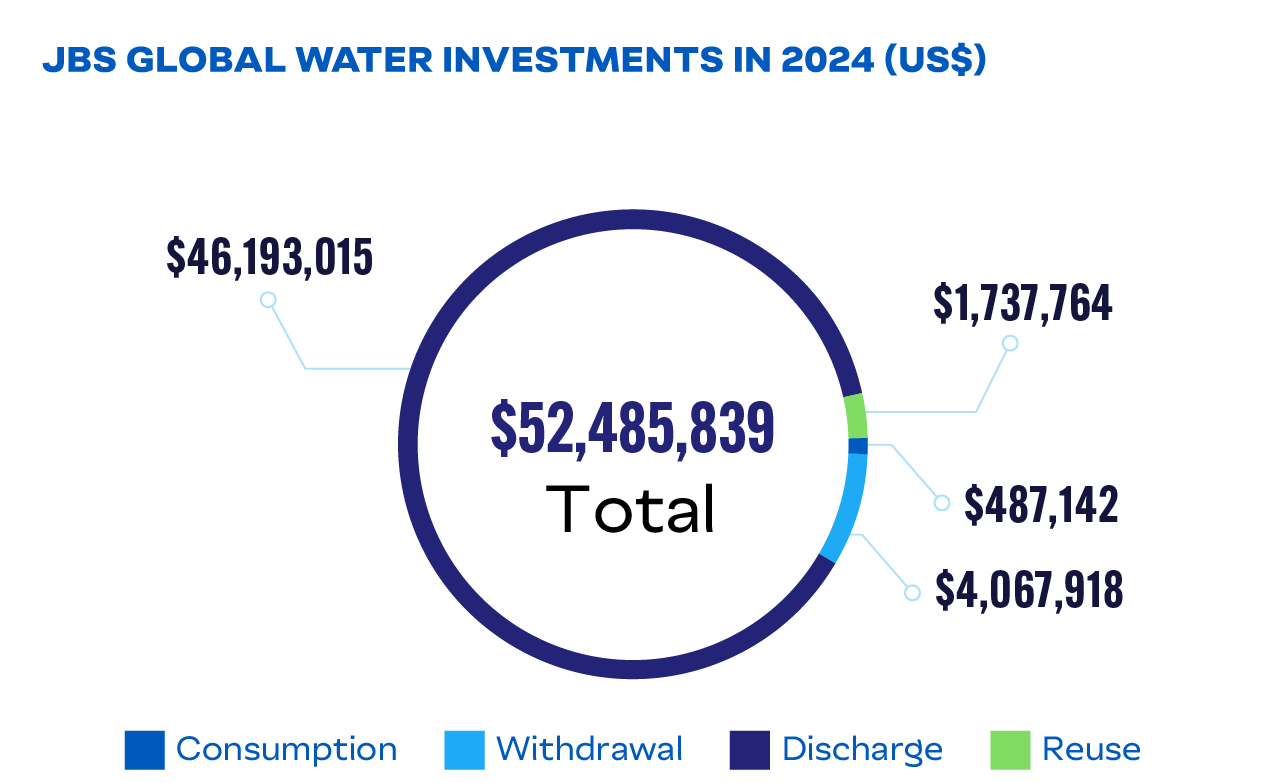
In 2024, we invested US$8.6 million in operational efficiency projects focused on water conservation and reuse in our own facilities. JBS environmental teams also participate in local watershed committees where they collaborate with fellow community members on actions that promote sustainable management of water resources. These forums allow for shared understanding of the specific classifications, definitions, plans, and proposals that relate to common local watersheds.
Water Management
(GRI 2-23, 303-3, 303-5, SASB FB-MP-140a.1)
JBS is focused on reducing water consumption and improving water management across our global operations. Guided by our Global Water Stewardship Policy, we aim to reduce our water use intensity by 15% by 2030 (from a 2019 baseline) while maintaining our high standards for food safety and sanitation. This aspiration drives innovation and collaboration across teams to develop strategies that enhance operational efficiency and minimize reliance on new water sources.
To promote accountability, JBS establishes facility-specific water-use goals supported by dedicated financial resources. Water conservation strategies are developed collaboratively across environmental, engineering, operations, and food safety and quality teams to uphold water quality and food safety protocols.
We track key metrics—including total water withdrawal by source, total water reused, and total water use intensity (water consumption per unit of production)—to identify opportunities for efficiency gains and maintain progress regardless of fluctuations in production levels.
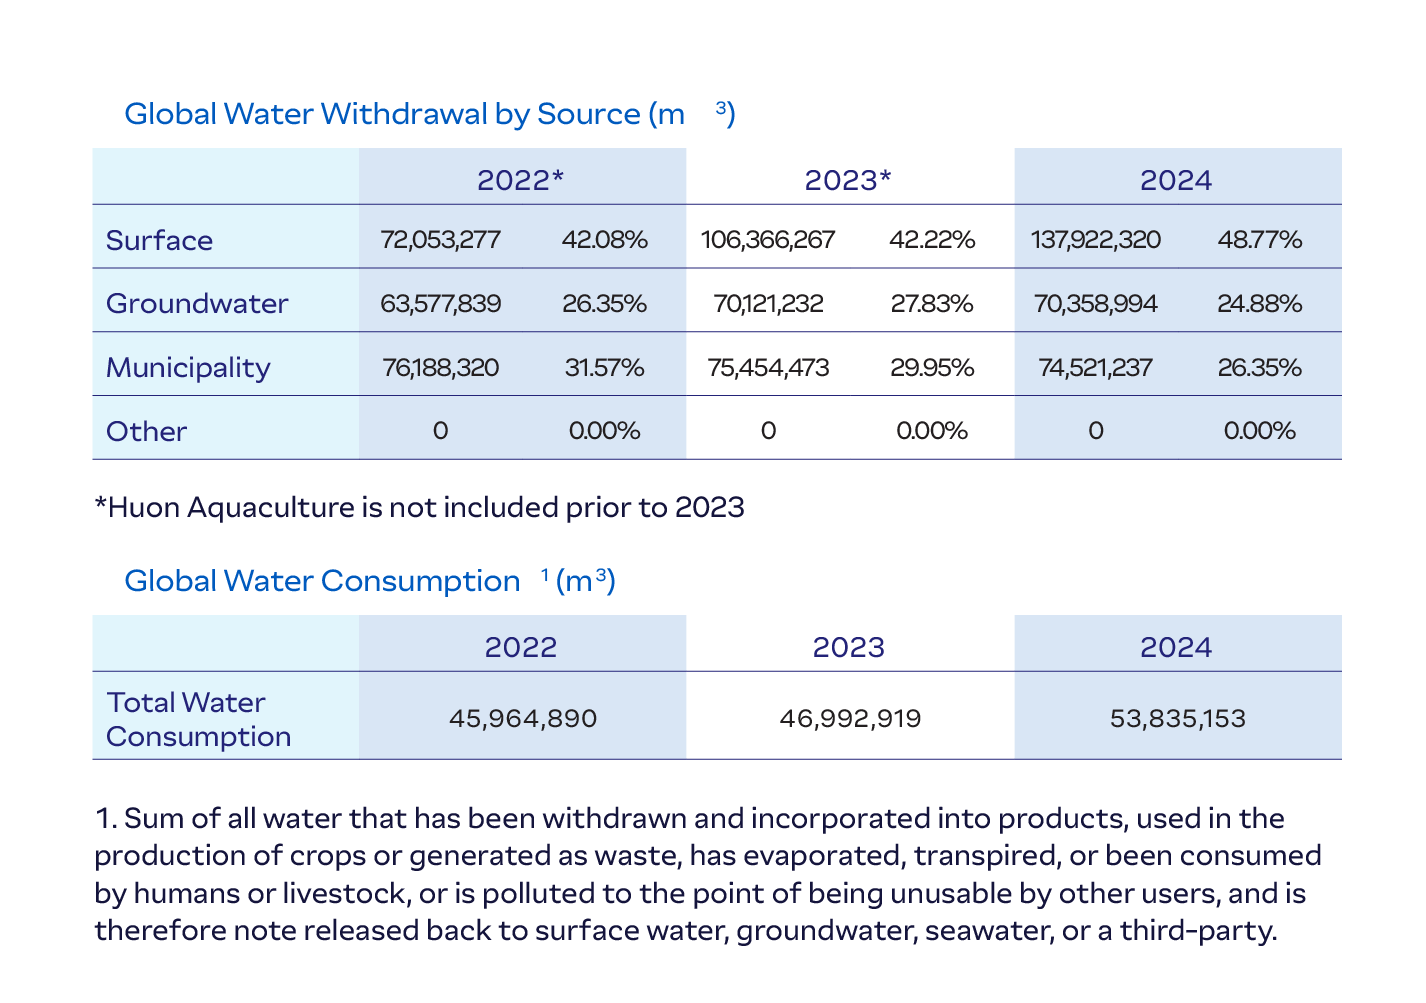 *Huon Aquaculture is not included prior to 2023
 1. Sum of all water that has been withdrawn and incorporated into products, used in the production of crops or generated as waste, has evaporated, transpired, or been consumed by humans or livestock, or is polluted to the point of being unusable by other users, and is therefore not released back to surface water, groundwater, seawater, or a third-party.
Wastewater Management
(GRI 303-2, 303-4)
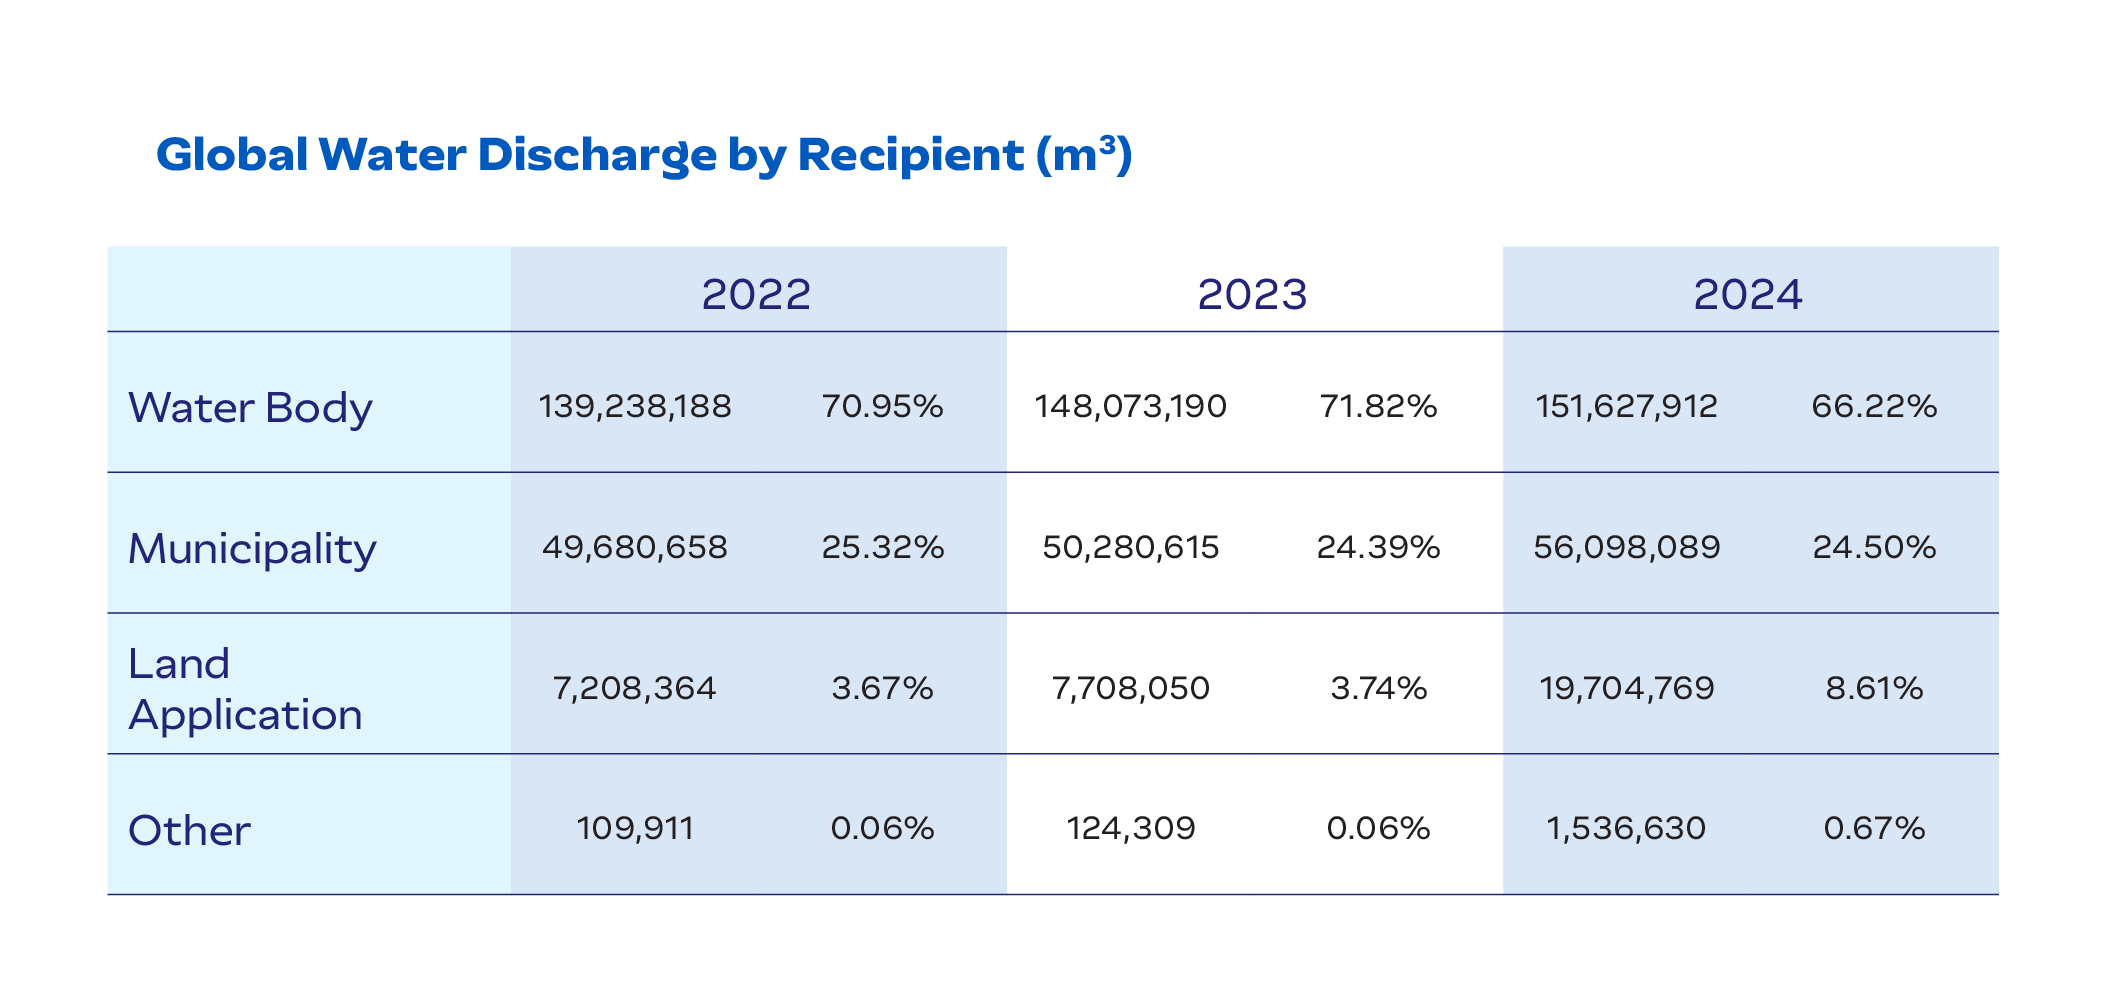
Across our global operations, JBS adheres to stringent policies and standards for responsibly treating and discharging effluents while minimizing environmental impacts.
Compliance with Global Standards
JBS implements customized wastewater treatment programs at each facility to meet specific discharge permit requirements. Depending on the operation, wastewater is either fully treated at our facilities or pretreated on-site then fully treated in the municipal system.
- Pilgrim’s Europe: Manages wastewater in compliance with various environmental regulators. A number of sites operate under environmental permits, which set strict limits around wastewater.
- Rigamonti: Carries out wastewater sampling via regulatory agencies according to the environmental authorization. Afterwards, HSE teams assess the results of the controls carried out with respect to the legal limits or any agreements with the managing body.
Advanced Monitoring and Reporting Systems
To further transparency and precision, we employ advanced tools and systems to monitor water discharge in our facilities. These technologies include:
- Water Meters: Provide real-time data on water discharge volumes.
- Electromagnetic and Ultrasonic Devices: Deliver accurate measurements of effluent flow rates.
- Parshall Flumes: Measure large-scale water flows with precision.
Monitoring frequency varies by region, with many facilities tracking usage daily and reporting monthly or quarterly to regulatory bodies. For example, Pilgrim’s Mexico maintains detailed records of water discharge through monthly reports, while JBS USA uses internal monitoring to verify wastewater system performance and compliance. These efforts enable JBS to identify inefficiencies, optimize treatment processes, and maintain accountability across its global operations.
Water Risk Assessment
(GRI 303-2, 303-4)
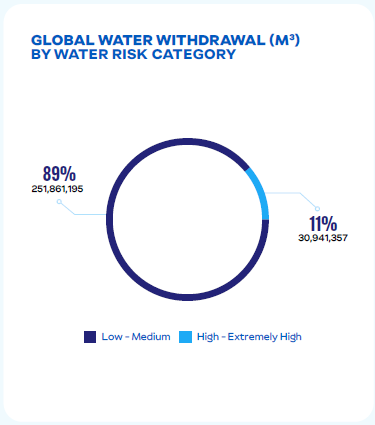
JBS conducts water risk assessments to prioritize locally relevant water resource projects and mitigate water-related risks. Using tools such as the World Resources Institute (WRI) Aqueduct and WWF Water Risk Filter, we assess exposure to risks related to quantity, quality, and regulatory or reputational factors.
These assessments allow us to identify areas with high, medium, and low water exposure to water-related risks, enabling targeted investments and proactive measures. We collaborate with stakeholders, including river basin committees and water authorities, to implement solutions that support long-term resource conservation and compliance with legal standards.

Global Facilities by Water Risk Category (GRI 303-3)

Global Water Withdrawal (M³) By Water Risk Category (GRI 303-3)
Case Studies:
- Water Pressure Reduction Trials: Conducted at Dinmore (QLD), Brooklyn (VIC), and Rockhampton (QLD), leading to significant savings.
- Water Sensors: Installed at Rockhampton, reducing water usage by approximately 50 kL/day and later rolled out to other sites.
